Digital

Master your IT through mapping your infrastructure

Abstract

This article explains why it is important to invest in a mapping of your information system to better manage your business; while providing a method to do so.

Introduction

The control of one’s data and information system (IS) requires a very heavy investment in time, money and infrastructure. But a business that manages to generate enough profit to invest in its IS is preparing for a better future.

Two parallels with services where an investment in infrastructure pays off later. We use electricity and the internet on a daily basis without even being aware of the complexity of the infrastructures supporting these services. If these were not reliable, we would have to worry about this underlying complexity because there would be many service interruptions! A good business IS follows the same rule. It should ideally be used without worrying about its availability or reliability, but such comfort for the users is only obtained if the investments have been made to think a good architecture through.

Thus, being able to invest in your IS is an excellent sign of futur-proofness and resilience in the face of technological disruptions, tougher legislation or competition. It is important to understand that the designs of current systems are made to make the user experience (UX) as pleasant as possible. Thus, the complexity of using interfaces is getting lower, while the complexity of what is happening “under the hood” is growing.

Definition of the information system: In order to agree on the terms, let’s define an information system as “the set of elements and their arrangement to deliver the services perceived by the users”. These “elements” can be processes, applications, virtual or physical servers etc.

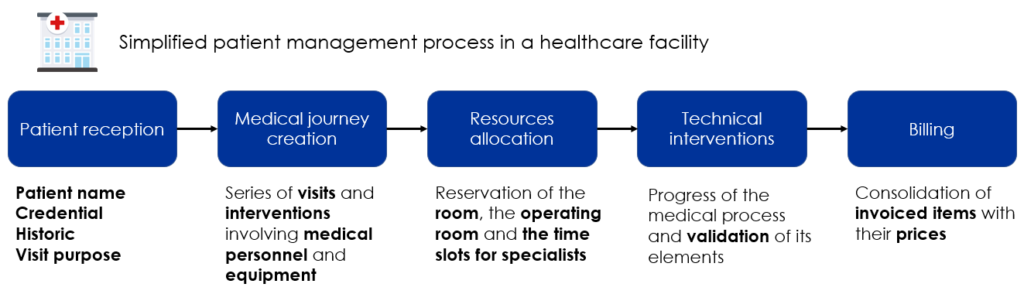
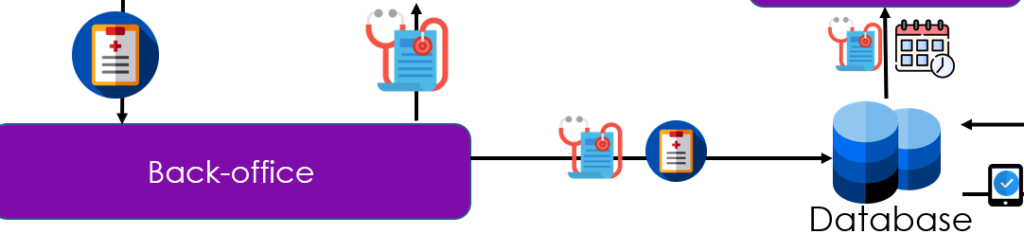
To illustrate our point, we will take the example of a healthcare facility and more precisely the process of welcoming and treating the patient, which we will greatly simplify.


We will see how to map the information system: Knowing which tools are used for what purpose, by whom, processing which data in your organization. To do this, we will consider three layers:

  • – The “process” layer: This is to describe the system from the point of view of the users.
    The latter use different tools within the framework of more or less defined processes. Data is processed at each stage of these processes. The description of the system in this dimension is technology agnostic. In other words, the processes are independent of the applications chosen to support them.

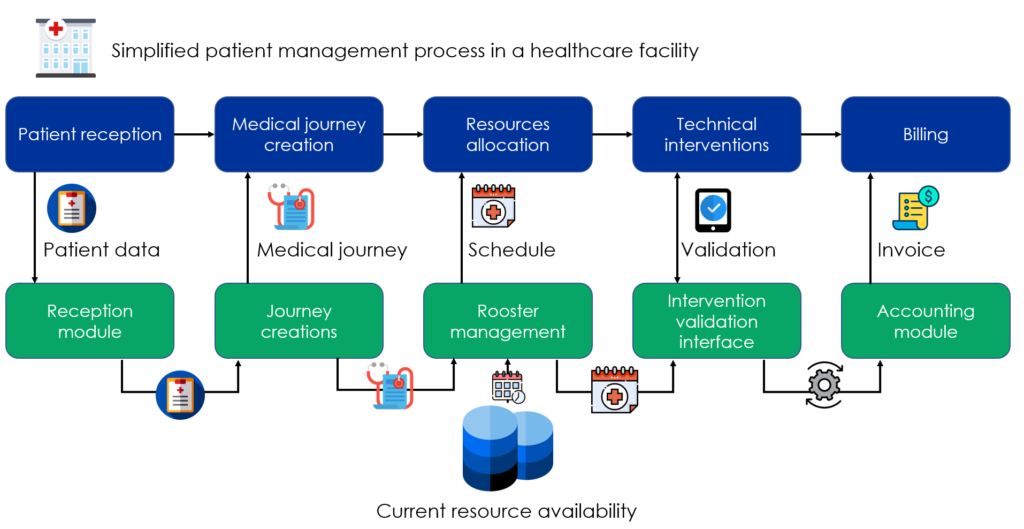
  • – The “Application” layer: Mirror of the production axis, the applications used to support the different processes identified in the “production” axis are described here. Concretely, anyone who works using a computer is actually interacting with the system through an application interface. It goes without saying that the data described in the processes are consistent at this level. Let’s consider the notion of IT “at the service” of business, which in principle does not impact the design of production processes but is simply constituted as a tool.
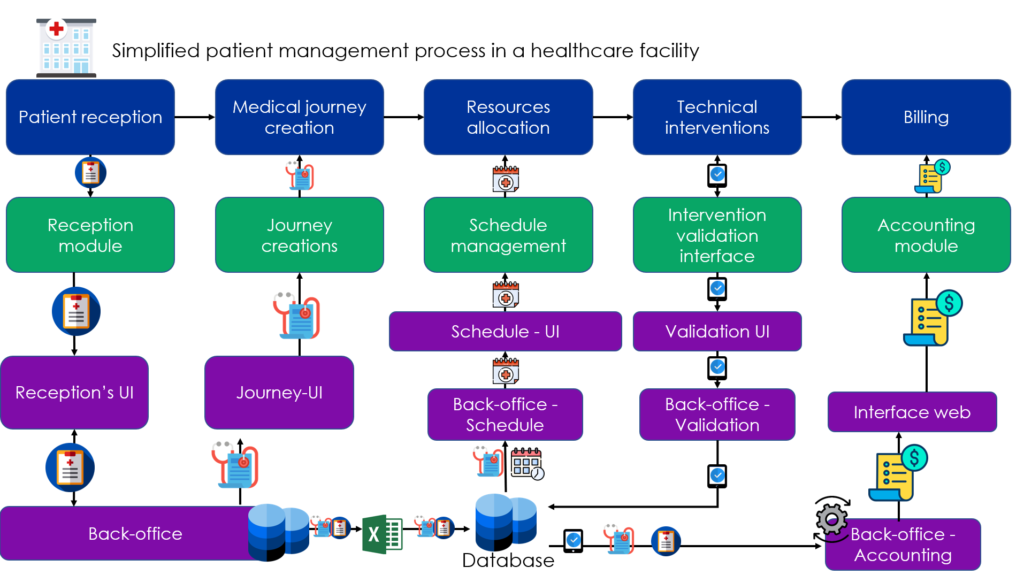
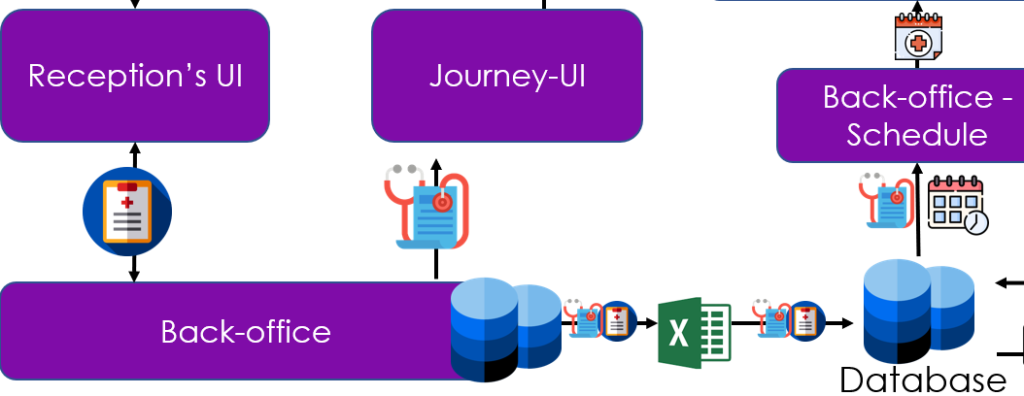
  • – The “technical” layer: This is to describe how applications are hosted, what channels they use to communicate. In order to display what the user sees on his screen, a set of elements qualified as “technical” are arranged. We commonly speak of “technical architecture” of an application or an information system. 


The "process" layer

To illustrate this step of the mapping, here is how the process is described from the perspective of users of the health facility system. Namely the patient, medical staff and administrative staff:


  • The patient is welcomed and his information is collected
  • Based on this information, the medical journey is set up
  • Allocation of resources (staff, rooms, equipment, etc.) according to their availability
  • Validation of technical interventions: Each practitioner confirms that he has performed his intervention correctly
  • Issuance of the bill

Each step of the process is linked to a set of data. It is imperative to maintain an exhaustive list of this data and its lineage through the system. We will see why later.


The "applicative" layer

Each step of the process is associated with an application that retrieves the data relating to this step and provides the necessary elements:

  • Reception staff collect patient data and enter it into the system
  • The medical journey generation module provides in return the patient’s own medical journey
  • For the next step, the resource allocation application provides a precise schedule
  • Then, each practitioner can validate his interventions, in regard to the schedule
  • Finally the accounting module provides an invoice based on the prices of each service entered into the system


The "technical" layer

Note: The technical architecture presented here is greatly simplified compared to the level of detail necessary for the description of an architecture in reality. However, as the purpose of this article is not to delve into technical details, this level of detail is sufficient for us.


Each application is supported by a set of technical architecture elements:


  • The reception module has its user interface and its back office retrieve patient information and allows it to be exported via an Excel file.
  • This back-office also supports the user interface which enables the patient’s medical history to be retrieved
  • For the allocation of resources, the database provides the Schedule’s back office with the data needed to calculate it. The schedule is then shared with users via the interface.
  • At the end of each technical intervention, the validation carried out by the medical staff is entered in the database
  • Finally, the back-end of the invoicing module retrieves all the elements necessary for the generation of the invoice, and makes the latter available through a web interface to users.

At this stage, we have mapped the information system from the processes involved, the applications supporting these processes and the technical architecture constituting these applications.


But why all these efforts?


We are now in a position to know which data is retrieved where, at what stage of which process and where this data is subsequently found in the information system. This mapping allows the following actions:


Plan an ideal infrastructure

At the end of the mapping, some possible improvements may appear. A common one regarding data is the scatteredness in several databases, or even in Excel files, and it would be desirable to bring them together in a single common source (SSOT). We see that the patient information is exported to an Excel file before being re-imported into the database used for scheduling and billing. This practice is not ideal for the following reasons


  • An Excel file may be inadvertently modified or accessed
  • Import and export require time and energy that could be used elsewhere
  • the data is not updated regularly in the database

Indeed, after having highlighted this point and questioned the staff, we realize that:

  • Schedules are only generated at given time after exporting and importing data twice a day, following a process that takes about twenty minutes,
  • This process is subject to some bugs
  • It generates stress among reception staff
  • It degrades the quality of the reception service during its execution

By taking into account the cost of implementing a direct connection between the back-office of the reception tool and the operational shortfall generated by this export / import process. It is obvious that it pays off, and quickly, to make this change. This evidence was hidden from us before our mapping work!


After two weeks of development, including testing and change management, this is what our new connection looks like!


Data mining, aka Business Intelligence

Now that we have an overview of the data present in the system, we can obtain useful information for the management of our company. One way to do this is to simply ask the questions we would like answered:

  • What is the average revenue generated per customer?
  • What is the margin generated by my various services?
  • For which diseases do my patients attend my establishment?

On the simple basis of our example, it is possible to generate metrics useful for the management of our establishment. As in this reporting for the example (done via PowerBI on false data)

In order to answer these questions, you need to be able to bring together and join data from different parts of the system: Patient data, benefit financial data, and time-based resource data.


We can see that with just the few data used in the example, we are already able to identify that the follow-up service is the one that generates the most profit. Although it is not one of the most expensive, the fact that it is systematically offered to patients, very appreciated, and this without generating very high costs explains this phenomenon. However, it is not easy to come to this relatively counter-intuitive conclusion without having mapped and mined your data.

Ensure legal compliance

The laws relating to data protection and the preservation of privacy are increasingly restrictive and above all, increasingly enforced. In the near future, any business will need to be accountable for the data it uses just as it has to undergo financial audits.

In order to manage this complexity within your information system, you must be able to trace the data:


  • What are the data sources?
  • For each source, what is the nature of the data collected and what is their sensitivity?
  • Where are my data stored?
  • Who is my data transmitted to?


Once the list of data has been established, it is necessary to identify the traceability of the data within the system, which makes it possible to ensure that the standards to which the company is subject are well respected!


Once again, the effort deployed in the mapping is paying off because all the information necessary for the rendering of accounts relating to the legislation is already present! One just have to take this information, and constitute it in a specific document.


Example of the aspects to be taken into account to prove compliance as part of an impact assessment for the GDPR:


Conclusion

IT systems are becoming increasingly important in all industries. We took the example of a healthcare facility, but the principles we have seen in this article can be applied to the vast majority of  business sectors. A system mapping process necessarily pays off in the long term, because it allows on the one hand to make informed decisions about its architecture, on the other hand to make the most of its data, in order to have optimal management of its organization. Finally, such a mapping makes it possible to divide its systems into several layers and to understand the growing complexity relating to data and privacy legislation.

Leave a Reply

Your email address will not be published. Required fields are marked *